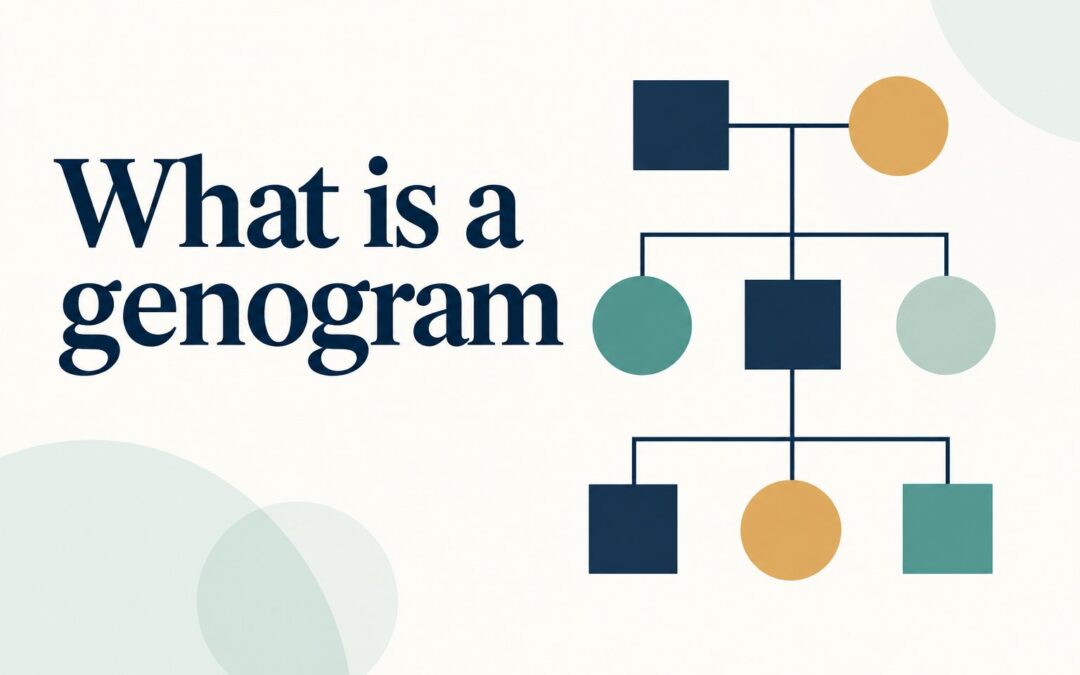
What is a genogram, and why do therapists, healthcare professionals, social workers, educators, and families use one? A genogram is a visual map of a family that records relationships, important life events, health information, and patterns across multiple generations. It may look similar to a family tree, but it communicates much more than names, marriages, and birth dates. A well-designed genogram can show emotional closeness, conflict, separation, illness, addiction, caregiving roles, and other influences that shape family life. By placing this information in one organized diagram, people can notice connections that may be difficult to recognize through conversation alone. This guide explains how genograms work, what their symbols mean, how to create and interpret one, and where they are commonly used. You will also learn about practical examples, common mistakes, privacy concerns, and best practices for producing a clear, respectful, and useful family map.
What A Genogram Means
A genogram is a structured diagram showing family members and the relationships between them, usually across at least three generations. It combines basic family history with emotional, social, behavioral, and medical information.
The concept was developed for clinical and family assessment, but its usefulness now extends far beyond therapy. Medical teams may use genograms to explore inherited conditions, while social workers may use them to identify support networks, caregiving demands, or sources of conflict.
Each person is represented by a standard symbol. Lines connect partners, parents, children, siblings, and other significant people. Additional marks may show divorce, estrangement, adoption, pregnancy loss, emotional closeness, abuse, or other relevant circumstances.
The amount of detail included depends on the purpose. A medical genogram might emphasize cancer, heart disease, and age at diagnosis. A counseling genogram might focus on communication, attachment, loss, substance use, and recurring relationship patterns.
A genogram does not provide a complete explanation of a family or predict anyone’s future. Instead, it organizes known information so that people can ask better questions, consider possible connections, and view individual concerns within a wider family system.
Key Parts Of A Genogram
Most genograms share several core elements. Learning these components makes it easier to read an existing diagram or create one that others can interpret accurately.
1. Individual Family Members
Every person receives a separate symbol, commonly a square for a male and a circle for a female. A name, birth year, age, occupation, diagnosis, or other relevant information may appear beside the symbol. Inclusive genograms can use clearly defined adaptations for gender identity and personal circumstances.
2. Partner Relationships
A horizontal line usually connects people in a marriage or committed partnership. Variations can indicate separation, divorce, cohabitation, or another relationship status. Adding dates may help readers follow when partnerships began or ended, especially when a family includes remarriages and blended households.
3. Parent And Child Connections
Vertical lines connect parents or caregivers to children. Siblings generally appear in birth order from oldest to youngest. Specific line styles can distinguish biological, adopted, foster, or step relationships, provided the diagram includes a legend explaining the symbols consistently.
4. Emotional Relationship Lines
Special lines may describe emotional dynamics such as closeness, distance, conflict, estrangement, dependence, or abuse. These connections make a genogram more informative than a standard family tree. Because emotional relationships can change, the map should reflect a particular period rather than permanent truth.
5. Health And Behavioral Information
Colors, shading, initials, or notes can represent physical illness, mental health conditions, substance use, disability, or significant behavior. Only information relevant to the genogram’s purpose should be included. Unverified assumptions should never be presented as confirmed diagnoses or established facts.
6. Major Life Events
Deaths, migrations, job losses, deployments, traumatic experiences, legal problems, and other turning points can provide valuable context. Recording dates helps reveal whether symptoms or relationship changes occurred around particular events. Sensitive details should be included carefully and only when they serve a legitimate purpose.
Why Genograms Are Important
A genogram turns a large amount of family information into a format that can be reviewed quickly. Its value comes from helping people see relationships among events, health concerns, roles, and generations.
- Reveals Repeating Patterns: It may highlight recurring conflict, early parenthood, separation, addiction, illness, or caregiving across generations.
- Improves Assessment: Professionals can gather family context instead of viewing a person’s concern as an isolated problem.
- Supports Better Questions: Visible gaps and patterns encourage focused, thoughtful conversations about family history.
- Identifies Resources: Close relatives, trusted friends, and dependable caregivers can be recognized as sources of support.
- Clarifies Health History: Multiple diagnoses in related family members may suggest a concern worth discussing with a qualified clinician.
- Builds Self-Awareness: People can examine inherited roles and expectations while recognizing that patterns can change.
Genogram And Family Tree Differences
Although a genogram resembles a family tree, the two tools serve different purposes. Comparing their features helps readers choose the right format for a particular task.
1. Purpose And Focus
A family tree primarily records ancestry and biological or legal connections. A genogram examines how people relate and how family experiences may influence current life. It is designed for assessment, reflection, and discussion rather than simply documenting lineage or preserving genealogical records.
2. Types Of Information
Family trees usually contain names, births, deaths, marriages, and places. Genograms can include those facts while also recording diagnoses, occupations, beliefs, behavioral patterns, emotional bonds, and major life events. The selected information should always relate to a clear question or goal.
3. Relationship Detail
A traditional family tree confirms that two people are connected. A genogram can also describe the quality of that connection, such as supportive, distant, conflicted, or cut off. This added layer is particularly useful when studying communication, caregiving, and emotional support.
4. Common Users
Genealogists and relatives often create family trees to research heritage. Genograms are commonly used by counselors, physicians, nurses, psychologists, social workers, and students. Families can also create them for personal reflection, although professional guidance may help when difficult experiences emerge.
5. Standard Symbols
Both formats use connecting lines, but genograms have a broader visual language. Symbols can communicate relationship status, death, adoption, pregnancy, health concerns, and emotional dynamics. Because conventions vary, a clear legend is essential whenever nonstandard markings, colors, or abbreviations appear.
6. Interpretation And Change
A family tree is generally a factual historical record that changes when new relatives are added or information is corrected. A genogram may change as relationships, diagnoses, households, and perspectives change. It should be treated as a working snapshot rather than a fixed verdict.
How To Create A Genogram
Creating a useful genogram requires more than drawing family connections. The following process keeps the diagram focused, readable, and respectful.
- Define The Purpose: Decide whether the map will explore medical history, emotional relationships, caregiving, communication, or another specific concern.
- Set Appropriate Boundaries: Identify which generations, people, time period, and types of information are relevant to that purpose.
- Gather Reliable Information: Use conversations, personal knowledge, and available records while marking uncertain details as unknown or unconfirmed.
- Draw The Core Structure: Add individuals, partners, parents, children, siblings, deaths, separations, and other basic family connections.
- Add Relevant Details: Record only the health, emotional, behavioral, cultural, or life-event information needed for the chosen goal.
- Create A Legend: Explain every line, color, abbreviation, and customized symbol so another reader can understand the diagram.
- Review For Accuracy: Check names, dates, connections, and labels, then separate confirmed information from personal interpretation.
- Protect Sensitive Data: Store the genogram securely and share it only with people who have an appropriate reason to see it.
Examples Of Genogram Patterns
Examples show how a genogram can turn separate family facts into meaningful questions. A visible pattern is a starting point for exploration, not proof of cause.
1. Recurring Health Conditions
A medical genogram may show heart disease affecting a grandparent, two siblings, and an adult child. This does not confirm that another relative will develop the condition. It can, however, support a more informed conversation with a healthcare professional about history, screening, and prevention.
2. Repeated Relationship Conflict
A relationship-focused map might show intense conflict between parents and children in several generations. The pattern could encourage discussion about communication, stress, expectations, and learned responses. It should not be used to blame one relative or reduce complex relationships to a single explanation.
3. Intergenerational Substance Use
A family may record alcohol or drug problems among several relatives alongside periods of loss, unemployment, or isolation. Seeing the wider context may help distinguish risk factors from personal fault. The map can also highlight relatives who achieved stable recovery and provided meaningful support.
4. Caregiving Across Generations
A genogram may reveal that one person repeatedly cares for children, older relatives, and family members with disabilities. That role can demonstrate resilience and commitment while also exposing possible exhaustion. The diagram may help a family discuss shared responsibility and additional sources of practical support.
5. Migration And Family Separation
When relatives move between regions or countries, a genogram can record migration dates, household changes, and periods of separation. This context may explain disrupted support systems, language differences, grief, or changing roles. It can also recognize adaptability, community connections, and cultural continuity.
6. Strong Support Networks
Genograms are not limited to problems. A map can identify close siblings, reliable grandparents, supportive neighbors, mentors, or long-term friends. Including these relationships provides a more balanced view and helps individuals recognize people and traditions that strengthen safety, identity, and resilience.
Practical Uses For Genograms
Genograms can serve many purposes when their scope matches the setting. The following applications illustrate how professionals and families may use them responsibly.
1. Family Therapy
Therapists may use a genogram to explore roles, alliances, boundaries, communication patterns, and unresolved losses. Building the map collaboratively can help family members compare perspectives. The objective is usually to encourage curiosity and constructive conversation, not to decide whose version of family history is correct.
2. Individual Counseling
In individual counseling, a genogram can connect present concerns with family messages, experiences, and coping styles. A client may recognize how expectations around achievement, emotion, or caregiving developed. This awareness can support change without suggesting that family history completely determines present behavior.
3. Medical Assessment
Healthcare professionals may document conditions such as cancer, diabetes, stroke, or heart disease across generations. Ages of onset and causes of death can be particularly relevant. A genogram supports history-taking, but it does not replace genetic counseling, testing, diagnosis, or individualized medical advice.
4. Social Work
Social workers can map household relationships, caregivers, absent relatives, community connections, and sources of stress. The resulting picture may support case planning and safeguarding decisions. Information should be gathered sensitively because clients may have incomplete knowledge or valid reasons for withholding certain details.
5. Education And Training
Students in counseling, nursing, psychology, and social care often create sample genograms to practice systemic thinking. Training should emphasize ethical handling of personal information. Learners may use fictional cases when sharing real family details would create unnecessary exposure, discomfort, or confidentiality concerns.
6. Personal Family Reflection
An individual can create a genogram to organize family stories, examine roles, or prepare questions for older relatives. The exercise may reveal both painful patterns and valuable strengths. If it triggers distress, pausing and seeking support can be more helpful than forcing the process to continue.
Common Genogram Mistakes To Avoid
A genogram loses value when it contains unclear symbols, unsupported conclusions, or excessive information. Avoiding these mistakes improves both accuracy and trust.
1. Starting Without A Clear Goal
Trying to record everything about every relative creates a crowded map with no useful focus. Begin with a specific question, such as identifying health history or exploring caregiving roles. A defined purpose helps determine which people, events, and relationship details genuinely belong in the diagram.
2. Treating Assumptions As Facts
Family accounts may conflict, and some details may be unknown. Label uncertain information instead of presenting it as established truth. Emotional descriptions are especially subjective, so it can be useful to record whose perspective is represented and when the observation was made.
3. Using Inconsistent Symbols
If the same line represents conflict in one area and separation in another, readers may misinterpret the entire map. Choose a symbol system before adding complex details. Include a legend and apply every symbol, color, and abbreviation consistently throughout the genogram.
4. Focusing Only On Problems
A diagram filled only with illness, conflict, and loss gives an incomplete picture of family life. Add supportive relationships, recovery, skills, traditions, and other strengths when relevant. A balanced genogram helps users identify protective factors instead of viewing the family solely through difficulties.
5. Ignoring Privacy And Consent
Genograms may contain health diagnoses, traumatic experiences, and sensitive relationship information about several people. Do not circulate the diagram casually or assume every relative wants to participate. Explain its purpose, minimize unnecessary details, and use secure storage suited to the setting.
6. Assuming Patterns Prove Causes
A repeated feature may suggest a useful question, but it does not establish why something happened. Similar outcomes can arise from genetics, environment, culture, chance, or interacting factors. Responsible interpretation uses cautious language and avoids predictions, labels, or accusations unsupported by proper evidence.
Best Practices For Useful Genograms
The best genograms remain clear enough to read while preserving the complexity and dignity of the people they represent.
1. Keep The Purpose Visible
Write down the main question before gathering information and revisit it during the process. This prevents the project from expanding without limit. If a new issue becomes important, consider creating a separate version rather than forcing unrelated information into one overcrowded family diagram.
2. Include At Least Three Generations
Three generations often provide enough history to reveal recurring relationships, roles, health concerns, and turning points. This commonly means including the central person, parents, grandparents, siblings, partners, and children. More generations can be added when reliable information and a clear reason exist.
3. Separate Facts From Interpretations
Names, dates, marriages, and documented diagnoses can be recorded as factual information. Labels such as controlling, distant, or dependent involve interpretation and should be treated carefully. Distinguishing observation from opinion makes the genogram fairer and supports more open discussion about different perspectives.
4. Use Neutral And Respectful Language
Avoid insulting descriptions, moral judgments, and unnecessary labels. Describe observable relationships or reported experiences as precisely as possible. Neutral wording does not minimize harm; it makes the record clearer and reduces the risk that the genogram becomes a tool for blame or humiliation.
5. Review The Map Collaboratively
When appropriate, invite relevant participants to check basic details and explain how they view important relationships. Collaborative review can uncover errors and missing strengths. It also demonstrates that the map is a shared exploration rather than an unquestionable assessment imposed by one person.
6. Update The Genogram Over Time
Families change through births, deaths, partnerships, moves, diagnoses, reconciliation, and estrangement. Add a creation or review date so readers know when the information was current. Updating the genogram preserves its usefulness and prevents an old relationship description from being treated as permanent.
How To Interpret A Genogram
Begin interpretation by reviewing the family structure. Note households, partnerships, separations, sibling groups, significant caregivers, and people who are absent. This establishes the basic context before emotional or medical patterns are considered.
Next, look for repetition across generations. Similar illnesses, occupations, losses, relationship changes, or caregiving roles may deserve attention. Repetition should lead to questions rather than immediate conclusions because several unrelated factors can produce similar outcomes.
Consider timing as well as frequency. A behavioral change that followed bereavement, migration, illness, or family separation may have a different meaning from one that appeared earlier. Dates can therefore be as informative as relationship lines.
Balance risk with resilience. Notice relatives who interrupted harmful patterns, maintained stable relationships, recovered from addiction, managed illness, or supported others through crises. These strengths may reveal useful coping resources within the family system.
Finally, interpret the map with humility. A genogram represents selected information from particular perspectives. It cannot capture every private experience or cultural influence. Important medical or psychological conclusions should be explored with appropriately qualified professionals.
Frequently Asked Questions
1. What Is The Main Purpose Of A Genogram?
The main purpose is to organize family structure, relationships, health information, and important events in one visual map. This can help individuals and professionals notice patterns, identify support, ask more focused questions, and consider how wider family experiences may relate to a present concern.
2. How Many Generations Should A Genogram Include?
A genogram commonly includes at least three generations because this range can reveal patterns that are not visible within one household. However, the right number depends on the purpose and available information. Additional generations are useful only when their inclusion adds relevant, reasonably reliable context.
3. Can I Make A Genogram By Myself?
Yes, you can create a personal genogram using paper or a digital tool. Begin with basic family connections and add only relevant information. Professional support may be helpful if the process involves trauma, serious conflict, uncertain medical history, or decisions requiring clinical interpretation.
4. Are Genograms Only Used In Therapy?
No. Therapists commonly use them, but genograms also appear in medicine, nursing, social work, education, family research, and personal reflection. The selected details change with the setting. A healthcare genogram, for example, usually emphasizes diagnoses and ages rather than emotional relationship patterns.
5. Is A Genogram A Diagnostic Tool?
A genogram can support assessment, but it cannot independently diagnose a physical or mental health condition. It organizes reported information and highlights areas for further investigation. Diagnosis requires appropriate evaluation by a qualified professional using relevant clinical evidence, history, and accepted assessment methods.
6. What If I Do Not Know My Family History?
You can still create a useful genogram by recording what is known and marking gaps clearly. Do not guess or pressure relatives to disclose private experiences. Limited information may itself reflect adoption, estrangement, migration, loss, or secrecy, but its meaning should not be assumed without evidence.
Conclusion
A genogram is a detailed visual map of family members, relationships, health concerns, major events, and patterns across generations. Unlike a basic family tree, it can show emotional dynamics, recurring roles, sources of stress, and valuable support. Its usefulness depends on having a clear purpose, consistent symbols, accurate information, and careful interpretation.
When created respectfully, a genogram can support reflection, professional assessment, and better family conversations. It should remain a flexible snapshot rather than a final judgment. Protecting privacy, acknowledging uncertainty, and balancing difficulties with strengths will produce a more honest and helpful picture of family life.